Manual deal screening is slow. Pulling comparable rents, estimating expenses, and rebuilding your underwriting spreadsheet for every new listing adds up to hours of wasted time — on deals that often don't even pencil. Whoof is built to do the first pass for you.
| Feature | What it's built to do |
|---|---|
| Criteria-based filtering | Set exactly what counts as a deal for you. |
| Cap rate auto-calculation | Built to estimate cap rate on every screened listing. |
| Cash flow auto-calculation | Built to estimate monthly cash flow on every listing. |
| Cash-on-cash return auto-calculation | Built to estimate your cash-on-cash return on every listing. |
| Listing alerts | Designed to alert you when a new listing matches your criteria. |
| Spot deals at a glance | Matching listings stand out from the rest of the search results on the map. |
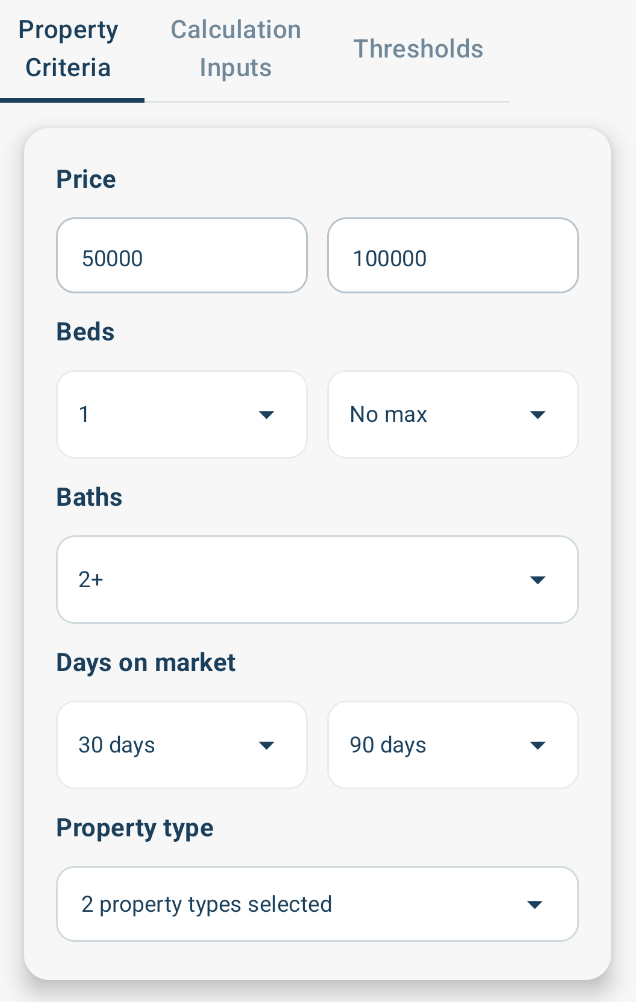
Every investor has a different definition of a deal. One investor targets single-family homes under $300,000 in Sun Belt markets; another focuses on small multifamily in the Midwest with a minimum cash-on-cash return threshold. Whoof is being built to let you encode your exact criteria so the screening engine works from your playbook, not a generic one.
You target the market Whoof currently covers, set your price floor and ceiling, and specify your investment thresholds — minimum cap rate, minimum monthly cash flow, minimum cash-on-cash return. Once configured, every screened listing will be evaluated against those parameters automatically.
This is designed to remove the decision fatigue of constantly re-evaluating whether a property is worth deeper analysis. If it doesn't meet your criteria, you won't see it. If it does, it will rise to the top of your queue — ready for a closer look.
Criteria filtering is the foundation the rest of Whoof is built on. Get this right once, and the rest of the workflow follows.

Cap rate — net operating income divided by purchase price — is one of the most widely used metrics for evaluating investment properties. But calculating it manually requires estimating gross rent, vacancy, insurance, taxes, and maintenance for each property. That takes time, and most investors skip it during the first pass.
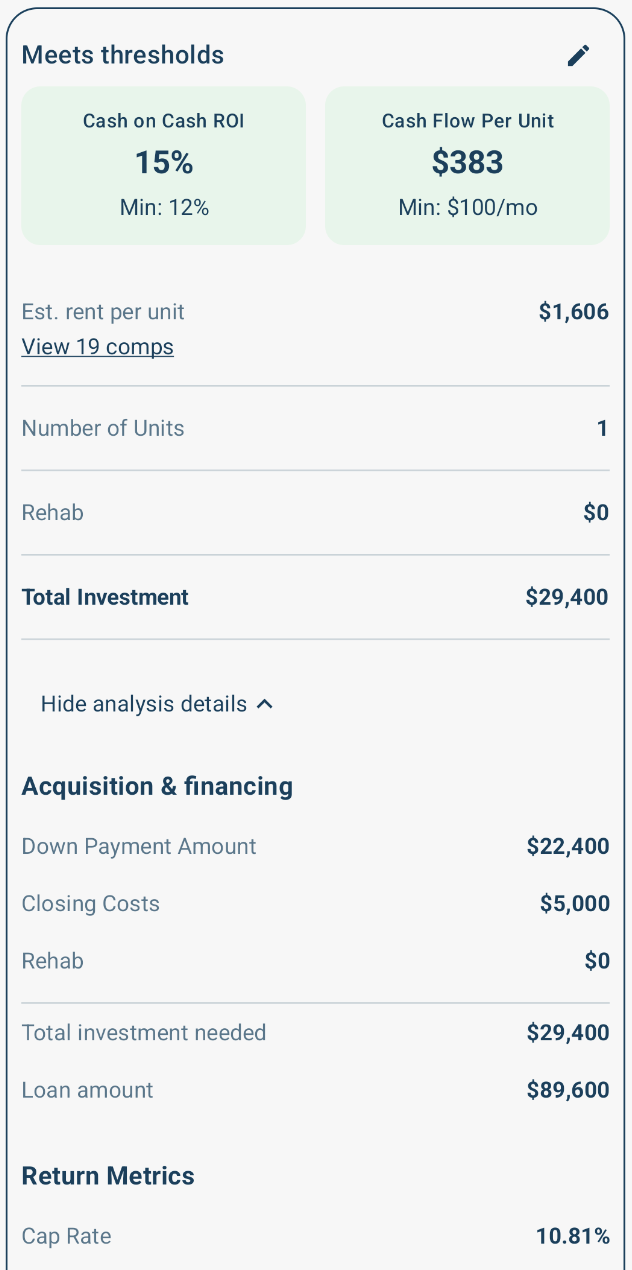
Whoof is built to calculate an estimated cap rate automatically for every listing it screens, using market rent estimates and typical expense ratios for the property type and location. The goal is for you to see the number without having to build the model yourself.
That means you'll be able to set a minimum cap rate threshold in your criteria — say, 5% — and Whoof will surface only properties that clear that bar. No more pulling up listings that won't work before you've done any math.
Cap rates are estimates, not guarantees. Whoof is designed as a first-pass screening tool, not a full underwriting platform. But having a credible estimate up front changes how you triage your deal pipeline.
For investors evaluating high volumes of listings, cap rate filtering alone can eliminate the majority of properties from consideration before you spend meaningful time on any of them.

Positive monthly cash flow is the difference between a rental property that builds wealth and one that quietly bleeds it. Calculating it accurately requires subtracting mortgage payment, insurance, property taxes, vacancy allowance, and maintenance reserves from estimated gross rent. That's a spreadsheet most investors have built — and rebuilt — dozens of times.
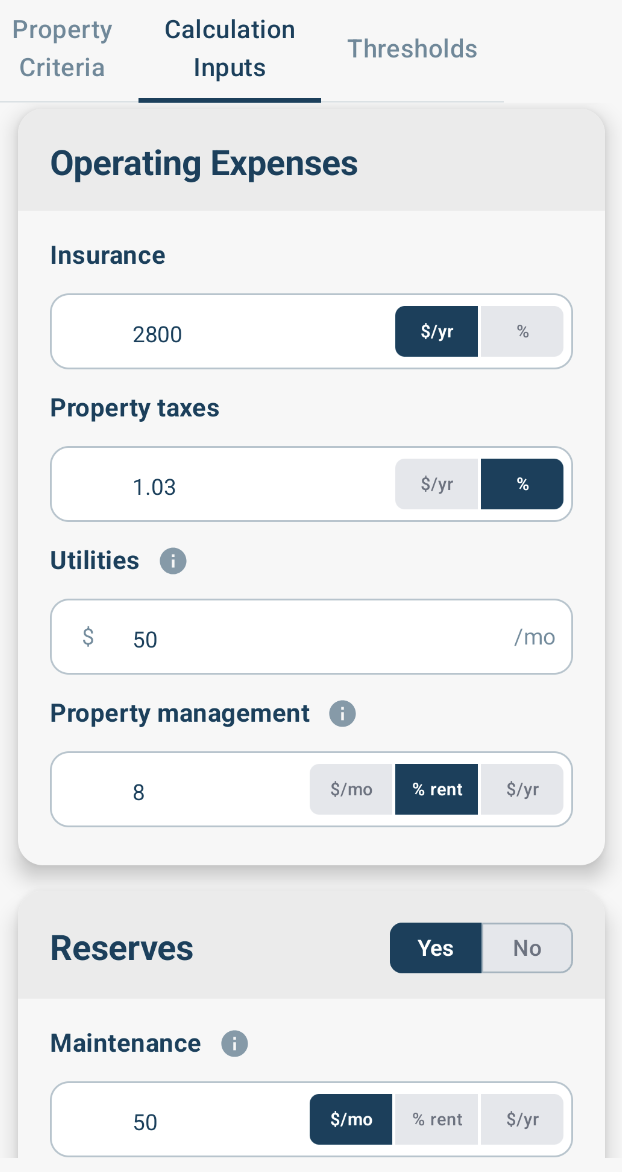
Whoof is designed to estimate monthly cash flow for every screened listing based on market rent data, standard expense assumptions, and a mortgage payment derived from the listing price with your specified down payment. The goal is for you to see the projected monthly number without running any numbers yourself.
You'll be able to set a minimum monthly cash flow threshold in your criteria — for example, $200/month per unit — and Whoof will exclude listings that don't meet it before they ever reach your queue. This keeps your pipeline focused on properties with real income potential.
Cash flow estimates are first-pass projections based on available data. They're meant to help you decide whether a property is worth deeper due diligence — not to replace it.

Cash-on-cash return measures annual pre-tax cash flow as a percentage of the total cash you've actually put in — down payment, closing costs, and any upfront rehab. It's a more practical metric than cap rate for leveraged investors because it reflects the actual yield on your out-of-pocket investment.
Whoof is built to calculate an estimated cash-on-cash return for every listing using your specified down payment percentage and estimated closing costs. The result is meant to be a single percentage you can compare across properties and set a minimum threshold on in your criteria.
Investors who target a minimum return — say, 8% cash-on-cash — will be able to configure that in Whoof and see only listings that meet or beat that threshold. This is especially valuable when comparing properties across different price points and markets.
Like all Whoof metrics, cash-on-cash estimates are projections based on available listing data and market inputs. They're designed to inform your first-pass decision, not replace a full underwrite.

In competitive markets, properties that cash flow don't sit around. By the time you manually check a portal, dig up the address, estimate the rent, and run the numbers, it may already be under contract. Speed matters — and that means knowing about qualifying listings the moment they appear.
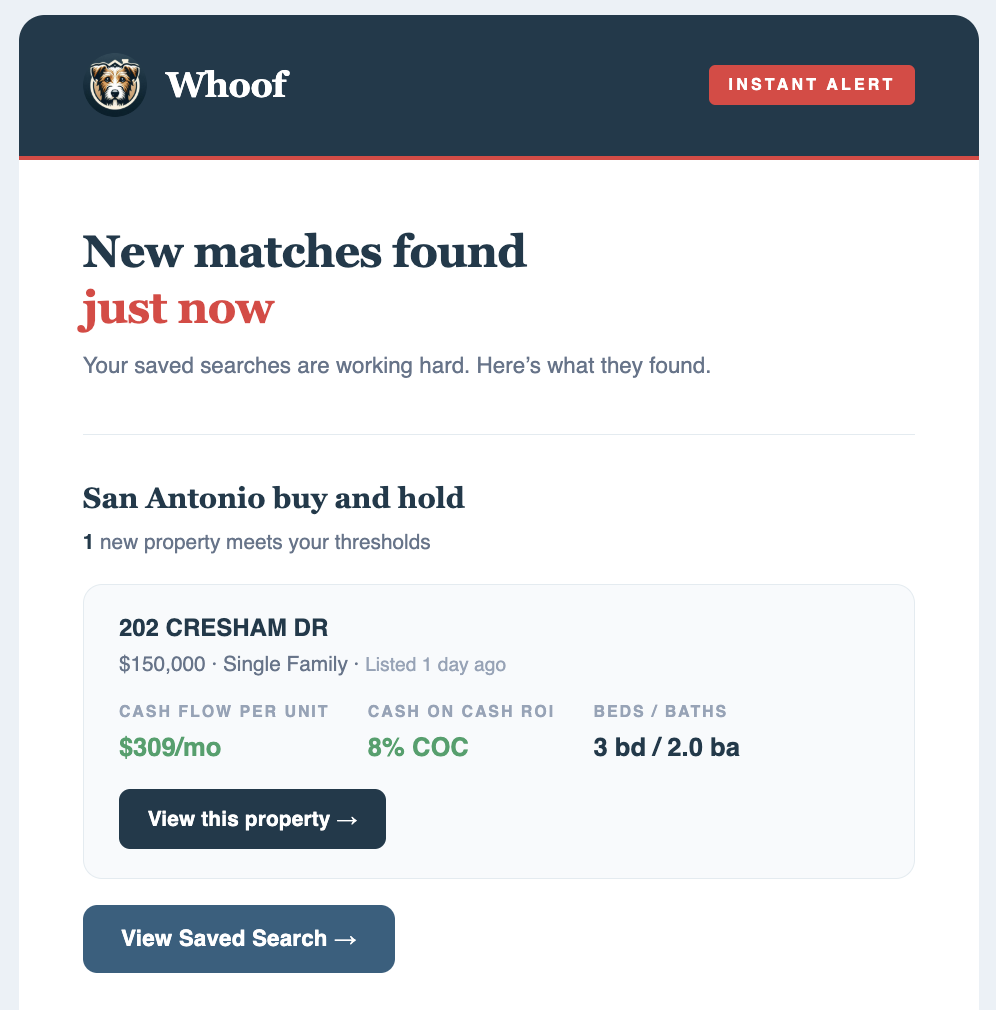
Whoof is designed to monitor new listings against your active criteria and alert you when something matches. You won't have to check in constantly or sift through properties that don't fit your strategy — the alert comes to you.
Each alert is built to include the key metrics Whoof calculates — estimated cap rate, monthly cash flow, and cash-on-cash return — so you can make a fast, informed decision about whether to dig deeper. You're not starting from zero; you're starting from a pre-screened summary.
Listing alerts are built to work in the background against your saved criteria — no daily check-ins, no missed opportunities because you weren't watching the market that day.

A list of qualifying listings is useful. Seeing those listings plotted on the map alongside everything else in your search area is what turns screening into spatial intuition — which neighborhoods are producing deals, which corridors are quietly stacking inventory, and where your criteria are too tight or too loose.
Whoof renders every property in your search alongside the subset that actually clears your investment criteria, using distinct icons so the two are easy to separate at a glance. Pan and zoom to compare deal density across neighborhoods, and click any pin to see the listing's estimated cap rate, cash flow, and cash-on-cash return inline.
The map gives you market context the list view can't — clustering, geographic edges, and outliers that are obvious visually but invisible in a sorted table.
It's the same data your alerts and saved searches run against, just rendered spatially so you can spot patterns instead of scanning rows.